

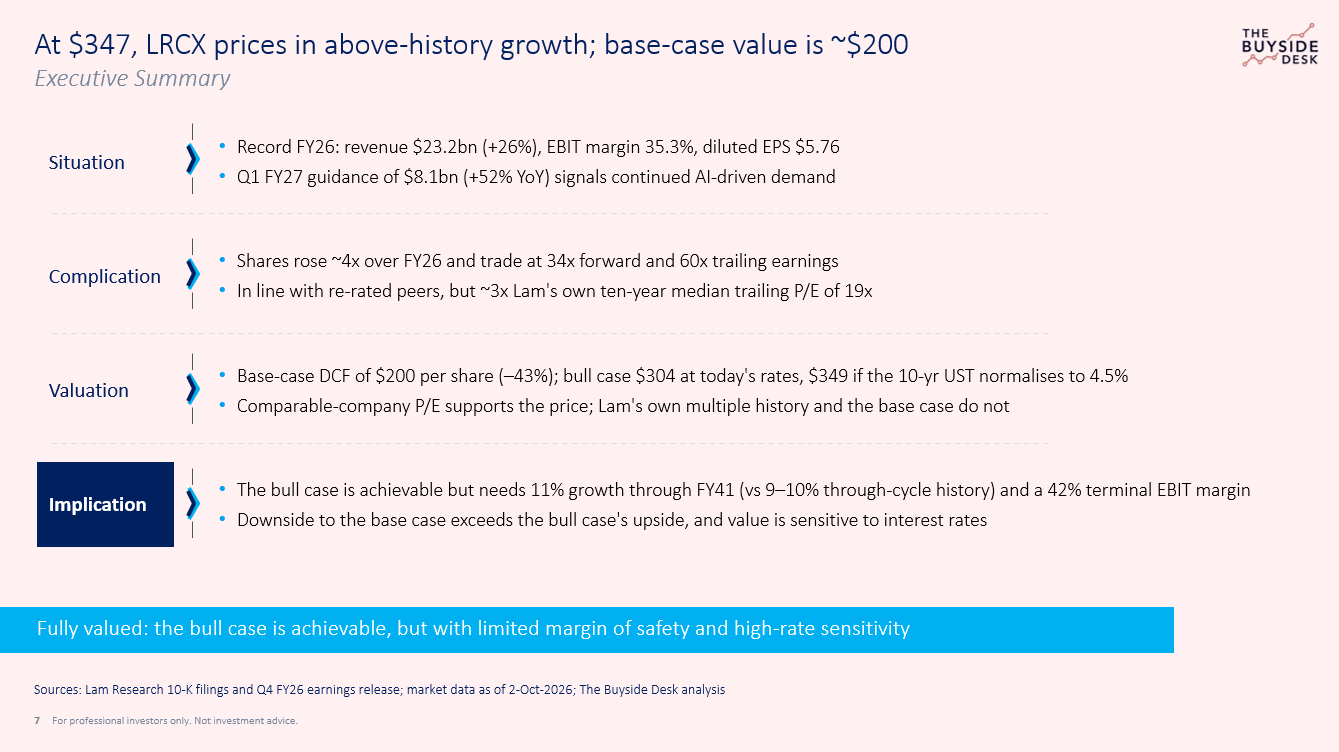
Lam Research shares (NASDAQ: LRCX) have been on a tear over the last year, rising 4x on AI driving a re-rating of the entire semiconductor industry. In brief:
The business is excellent. Record FY26 revenue of $23.2bn (+26%), a 35% EBIT margin and $35bn returned to shareholders over a decade
The stock is priced for the bull case. At $347, our base case is worth ~$200 per share (–43%). Our bull case is worth $304, or $349 if the 10-year Treasury falls back to 4.5%
Peers support the price; Lam’s own history does not. Lam trades in line with re-rated peers at ~34x forward earnings, but at ~3x its own ten-year median trailing P/E
Our view: LRCX is fully valued. The bull case is achievable, but the price leaves limited margin of safety and is highly sensitive to interest rates
Lam Research stock is having a terrific year to date
Lam Research shares rose roughly fourfold over fiscal 2026 (July 2025 to June 2026). They closed at $347.49 on 2 October, for a market value of about $436bn. Their operating story justifies investor excitement. Lam posted its fourth consecutive quarter of record revenue in June, and guided the September quarter to $8.1bn, up 52% year on year. Management credits AI for the momentum.
“AI-driven demand continues to reshape the semiconductor industry.” - CEO Tim Archer, Q4 FY26 earnings release
However, the question for investors is not whether Lam is a great business or whether it benefits from the AI spending boom, the real question is: at $347, are you buying reasonable growth at a fair price, or paying today for an outcome that has to go right for the next fifteen years?
To answer it, we rebuilt Lam’s last ten years of financials from its 10-K filings, projected twenty years forward under three scenarios, and tested the result against peers and Lam’s own trading history.
What Lam actually does
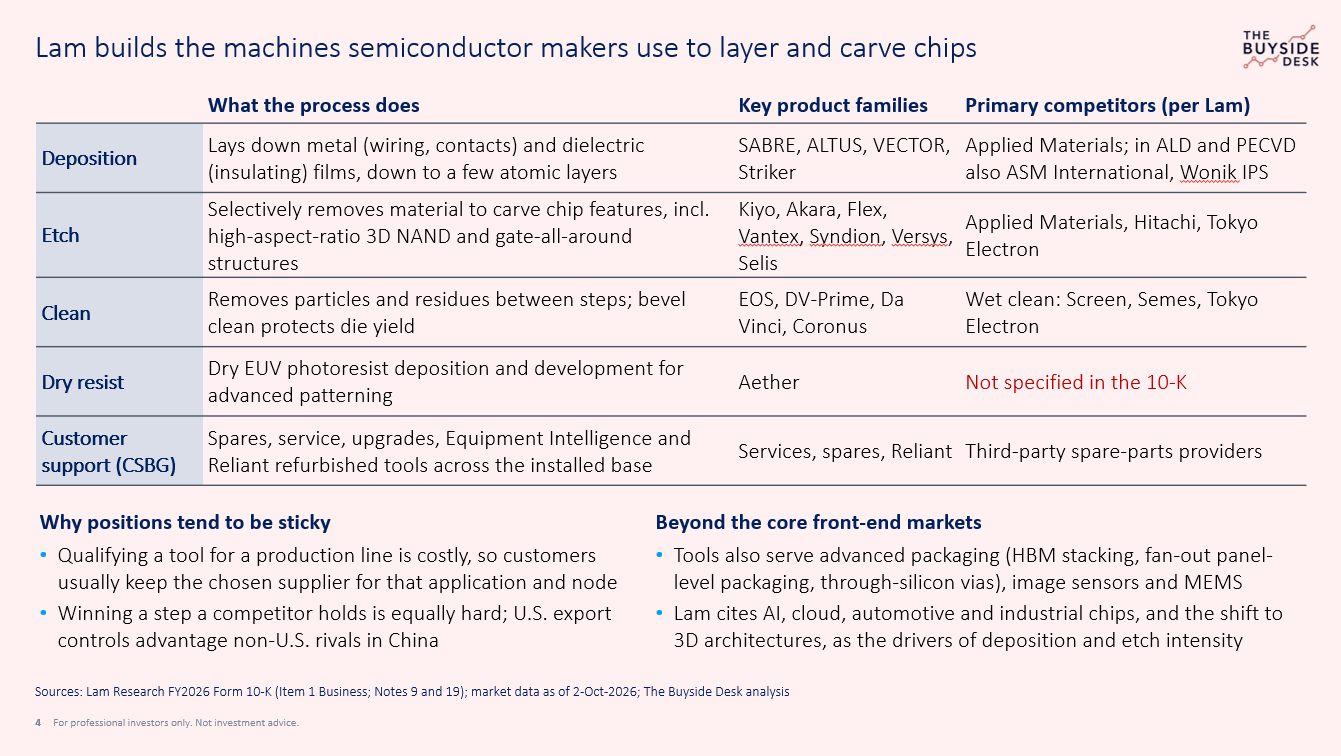
Lam builds the machines chipmakers use to build chips. A modern chip is built by repeating two core steps hundreds of times. Deposition lays down ultra-thin films of metal or insulating material, sometimes only a few atoms thick. Etch then carves away material to leave the circuit pattern behind. Lam is a leader in both, plus the clean steps in between. Also, these steps are extremely difficult to do and require incredible technical capabilities. In other words, Lam enjoys very strong competitive moat.
The shift from flat (2D) chips to vertically stacked (3D) designs makes this harder and even more valuable. A 3D NAND memory chip or a gate-all-around transistor needs far more deposition and etch steps per wafer. That rising intensity is the structural tailwind behind Lam.
Lam’s main competitors are Applied Materials and Tokyo Electron, with Hitachi in etch and ASM International in some deposition steps. Positions are very sticky:: once a chipmaker qualifies a tool for a production step, it usually keeps that supplier for the life of that technology node.
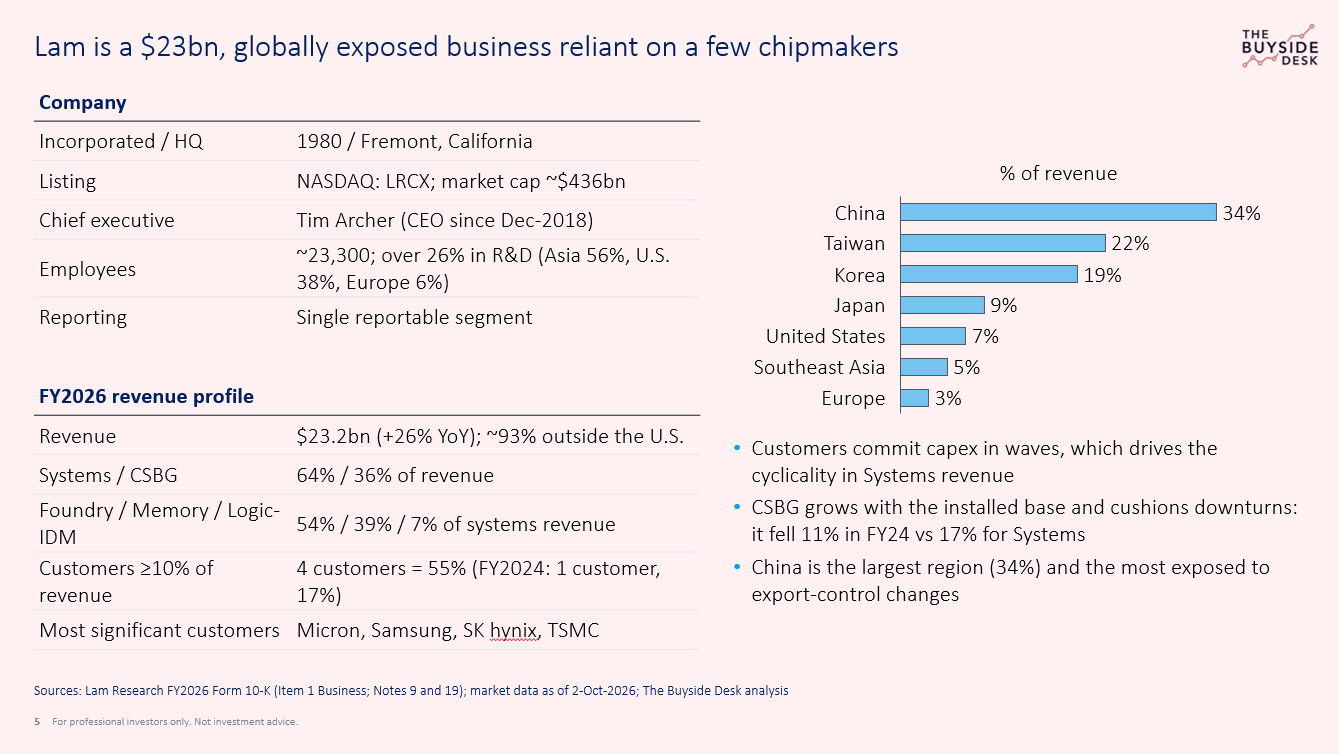
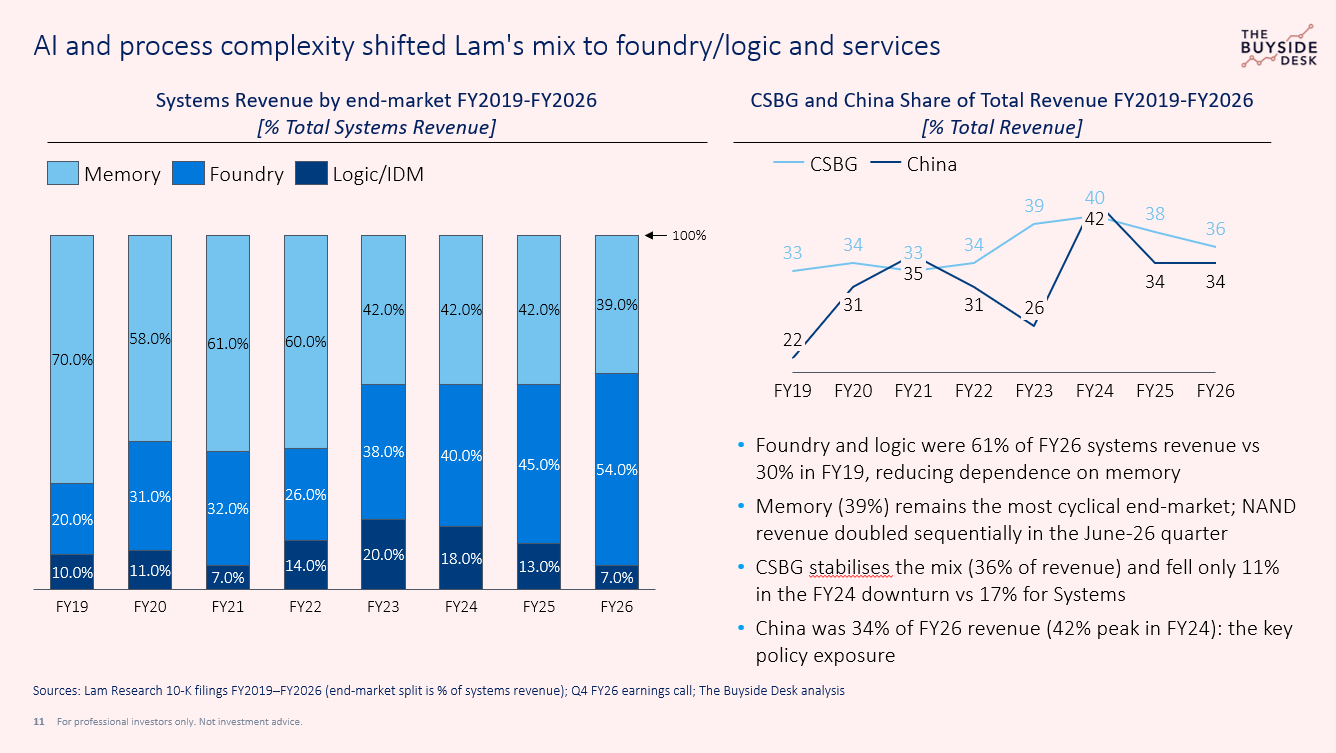
The second half of the business matters as much as the tools. Lam’s Customer Support Business Group (CSBG) sells spares, service, upgrades and refurbished tools into its large installed base. CSBG was 36% of FY26 revenue and fell only 11% in the FY24 downturn, against 17% for new systems.
The customer base is concentrated. Four customers each took 10% or more of FY26 revenue, 55% combined; Lam names Micron, Samsung, SK hynix and TSMC as its most significant. China was the largest region at 34% of revenue.
The last 10-years: great growth, but cyclical business
On the headline, Lam’s record is outstanding. Revenue grew from $5.9bn in FY16 to $23.2bn in FY26, a compound rate of 14.7% a year. But that number flatters the business, because of where it starts and ends. FY16 sat early in a memory upcycle, and FY26 sits in the middle of the AI build-out. Measure between comparable points in the cycle and the picture changes:
Measurement window:
Ten-year headline (FY16-FY26): 14.7% revenue CAGR
Peak to Peak (FY18-FY23): 9.5% revenue CAGR
Trough to Trough (FY19-FY24): 9.1% revenue CAGR
The cycle has not gone away. Revenue fell 13% in FY19 and 14% in FY24, and the second downturn came while AI spending was already ramping. Strong AI demand was outweighed by weak memory, PC and smartphone spending.
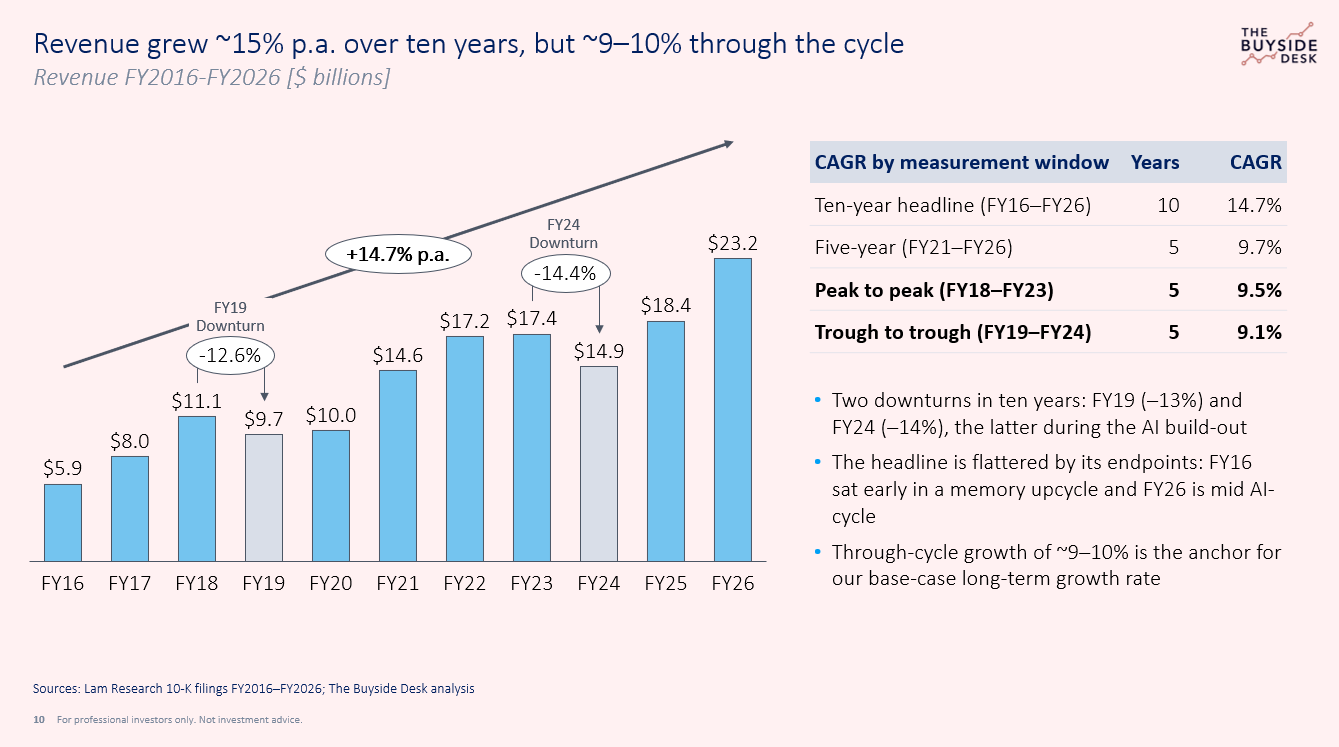
This matters for valuation. Our base case assumes Lam grows at 9% a year from FY32 to FY41, in line with its own through-cycle history. It is a reasonable assumption, not a pessimistic one.
The AI shift: a better mix, but not more market share
AI has changed what Lam sells and to whom. Foundry and logic customers made up 61% of FY26 systems revenue, up from 30% in FY19. Memory, historically Lam’s core and its most cyclical market, fell from 70% to 39%. Though Memory is far from dead, with Lam’s CEO highlighting a doubling of NAND revenue from the prior quarter in the most recent Q4 FY26 earnings call.
The mix shift arguably makes Lam less cyclical than before, which may be part of the reason the shares have re-rated higher in the last year. Services help too: CSBG has held at 33–40% of revenue since FY19 and grows with the installed base.
One finding stood out in our work. Lam’s share of global semiconductor equipment spending, as reported by SEMI, has stayed at roughly 14–16% since 2018. Lam has grown because the industry grew, not because it took share.
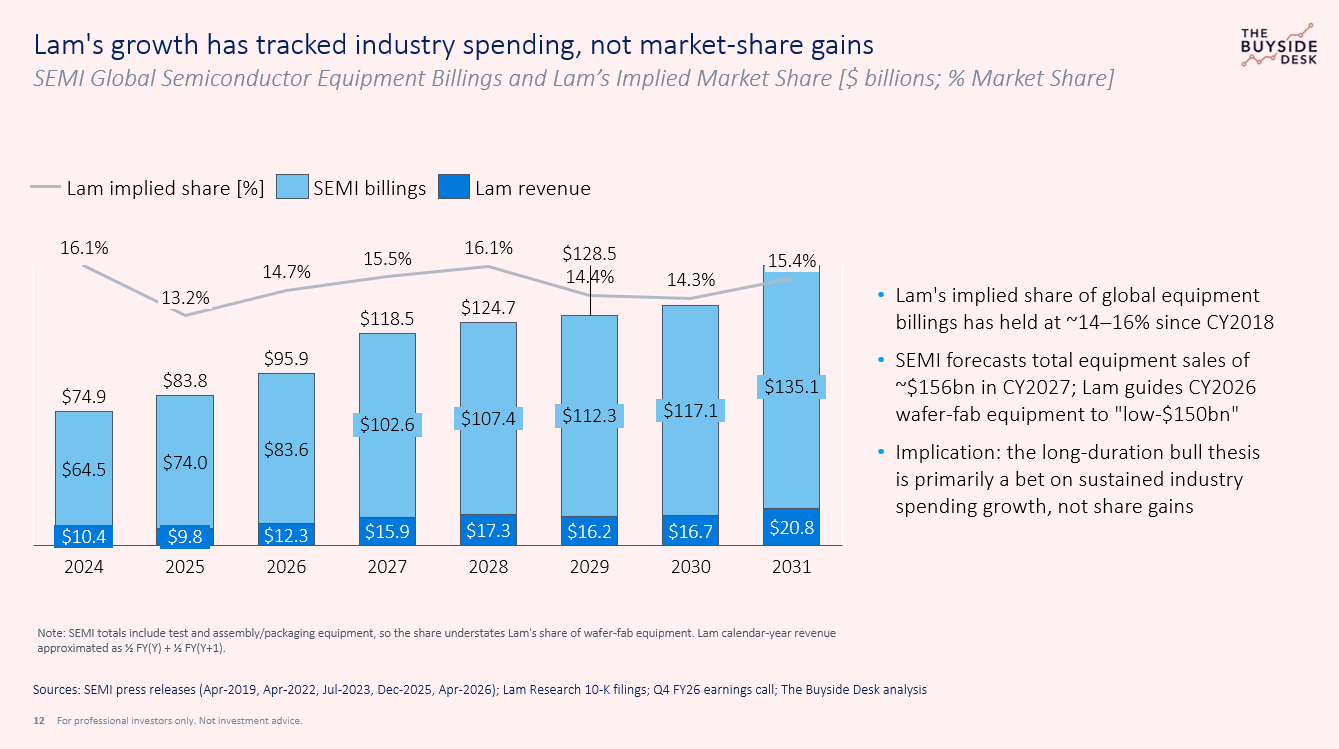
That reframes the bull case. A bet on Lam compounding for decades is really a bet on industry equipment spending compounding for decades. SEMI forecasts total equipment sales of about $156bn in 2027, and Lam guides 2026 wafer-fab equipment spending to the low $150bns.
A high quality business: margins, cash and capital returns
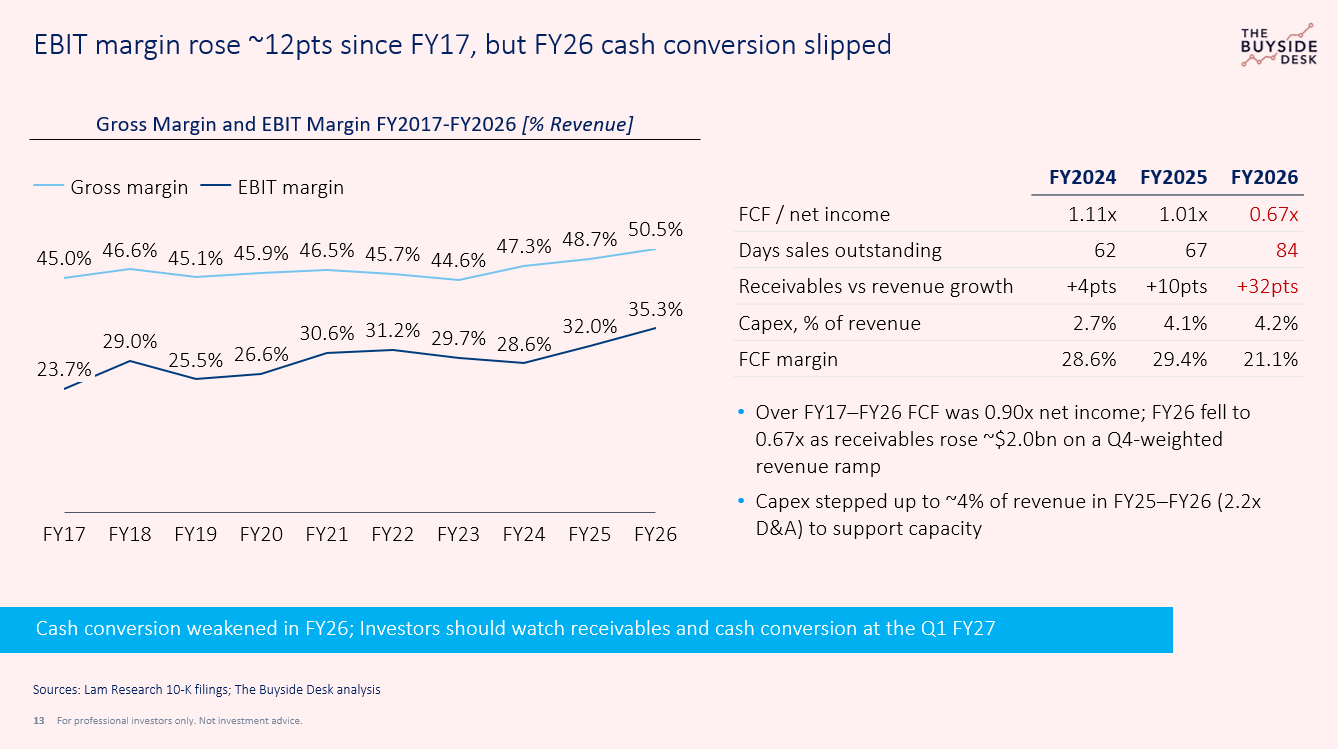
Lam has become much more profitable. EBIT margin rose from 23.7% in FY17 to 35.3% in FY26, and gross margin reached 50.5%. One number in particular deserves attention. Over the decade, free cash flow averaged 0.90x net income, which is healthy. In FY26 it fell to 0.67x, as receivables jumped about $2.0bn on revenue weighted heavily toward the June quarter. Days sales outstanding rose to 84, from 61–67 in the prior two years. For now, we regard this as more of a timing issue and not a quality problem. Nevertheless, this issue is on our radar for upcoming earnings calls (next one is Oct. 21st).
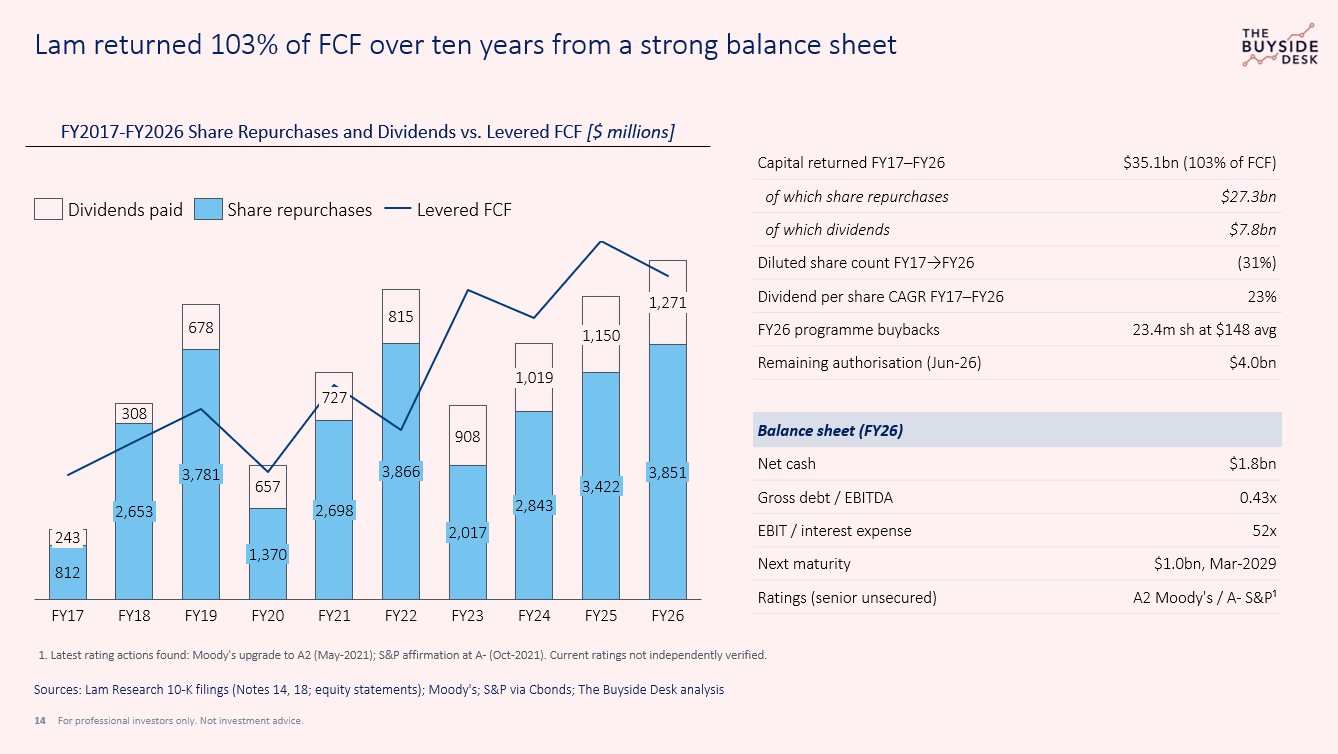
Capital allocation has been shareholder-friendly. Over FY17–FY26, Lam returned $35.1bn, or 103% of its free cash flow: $27.3bn in buybacks and $7.8bn in dividends. The diluted share count fell 31%. Returning more than 100% of cash flow can sound like borrowing to pay shareholders. It was not. Over the decade Lam repaid $1.2bn more debt than it issued. The small gap was funded by employee stock purchases and by running down its investment portfolio. Debt was used tactically in some years, notably FY19, and repaid later.
Two important and reassuring details:
R&D was never squeezed. It grew every year, from $1.0bn to $2.4bn, including through both downturns.
Buybacks showed price discipline. Lam bought 19.1m shares at an average of ~$128 in the first half of FY26, but only 0.8m in the June quarter at ~$325.
The balance sheet remains conservative: $1.8bn of net cash, gross debt of 0.43x EBITDA, and no maturities before 2029.
The near term: strong, and already in consensus
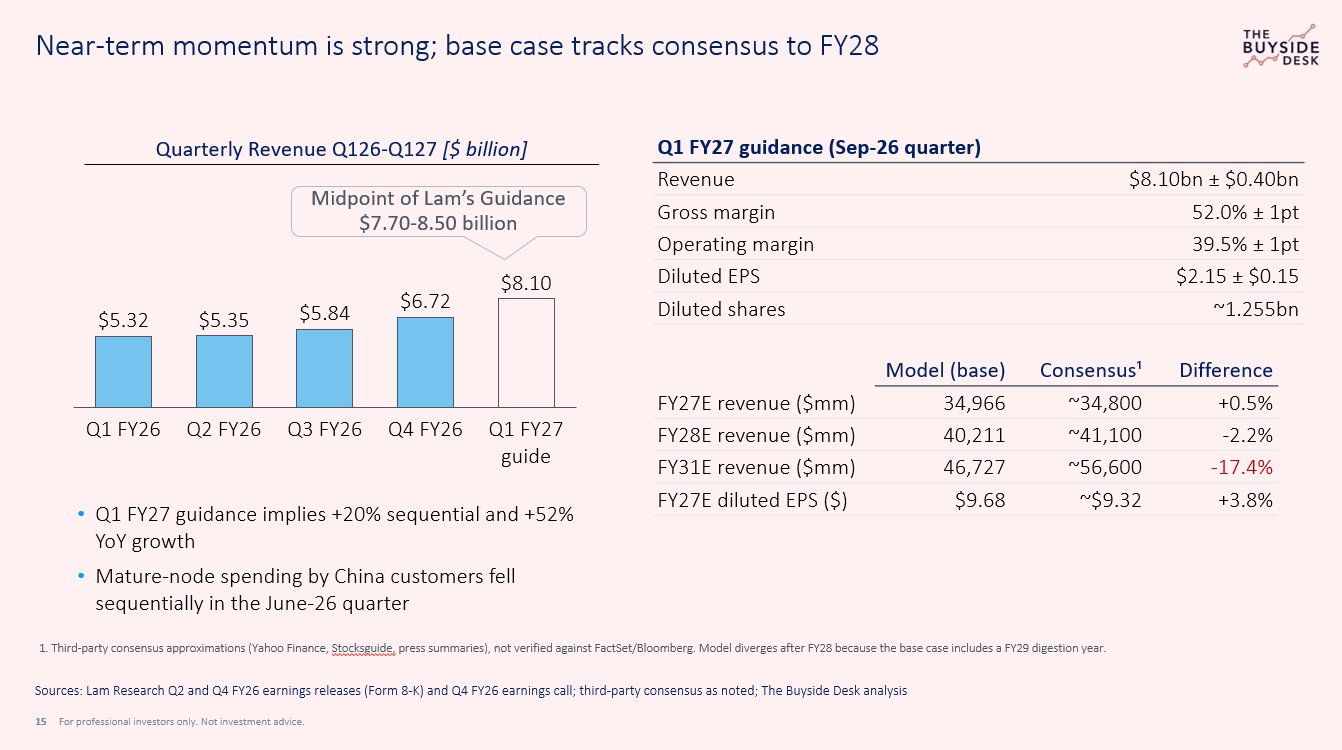
The next few quarters look strong. Lam’s guidance for the September quarter (Q1 FY27): Revenue: $8.10bn ± $0.40bn, Gross margin: 52.0% ± 1pt, Operating margin: 39.5% ± 1pt, Diluted EPS: $2.15 ± $0.15. At the midpoint, that is 20% sequential growth and 52% year on year. Our base case, anchored to this guidance, produces FY27 revenue of $35.0bn and EPS of $9.68, within a few percent of third-party consensus.
Our divergence comes later. Our base case assumes a digestion year for new-tool sales in FY29, as customers absorb the current wave of capacity. Consensus assumes no such pause, putting FY31 revenue about 17% above our base case.
For us, the real question is about how long the growth lasts, and what it is worth today.
I would normally paywall much of this article’s content - including the valuation section below. For this article, I will be making it entirely free and will later be making the LRCX Analyst Deck (42 slides) and full Valuation Model (excel) available for free as well. My request: consider becoming a paid subscriber.
Valuation: what is Lam worth?
Quick note on methodology: We value Lam with a discounted cash flow (DCF) model and cross-check it against trading comps. Two common alternatives don’t fit. A sum-of-the-parts needs separate segment profits, and Lam reports as one segment. Precedent transactions need comparable takeovers, and there are none at Lam’s scale.
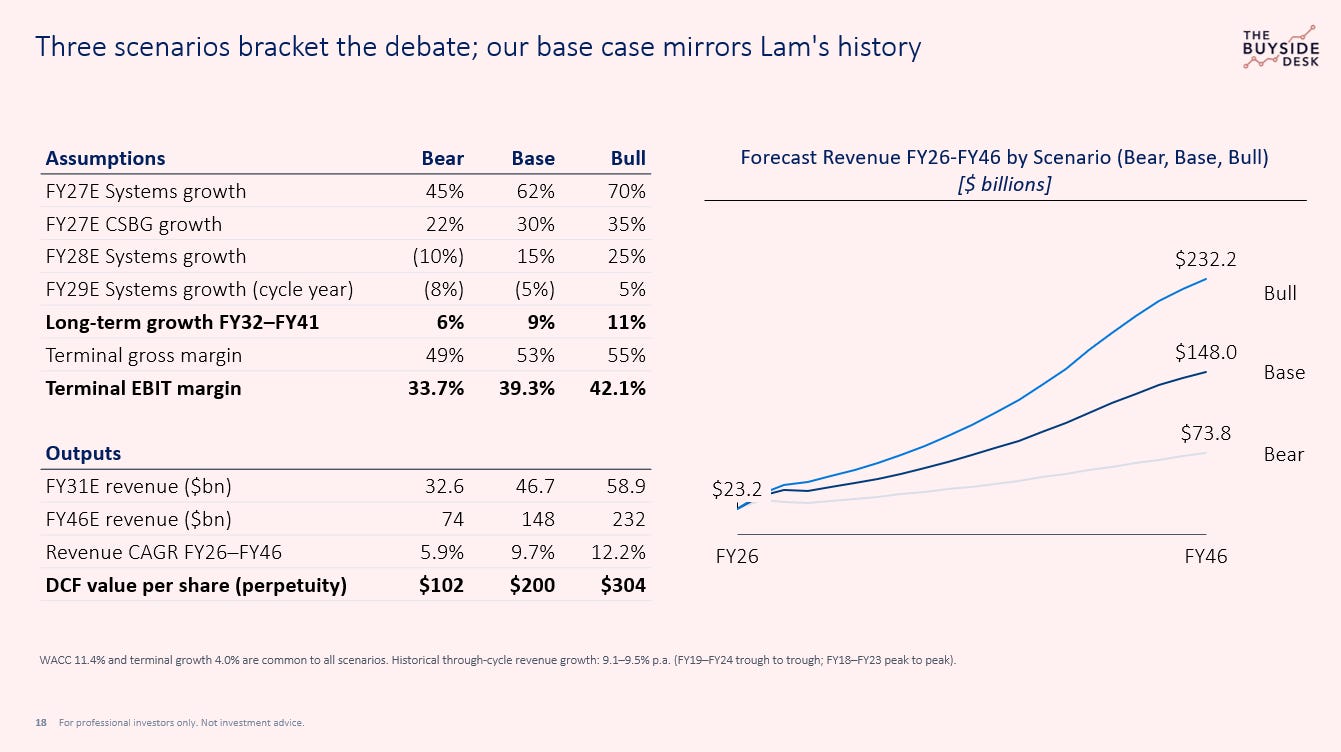
Because the growth debate is about duration, we forecast twenty years (FY27–FY46) rather than the usual five or ten. This is a crucial point because a longer forecast period allows us to smooth out the cyclical nature of the business. Each scenario runs in three stages: explicit forecasts to FY31, a sustained-growth decade to FY41, and a fade to 4% long-run growth by FY46.
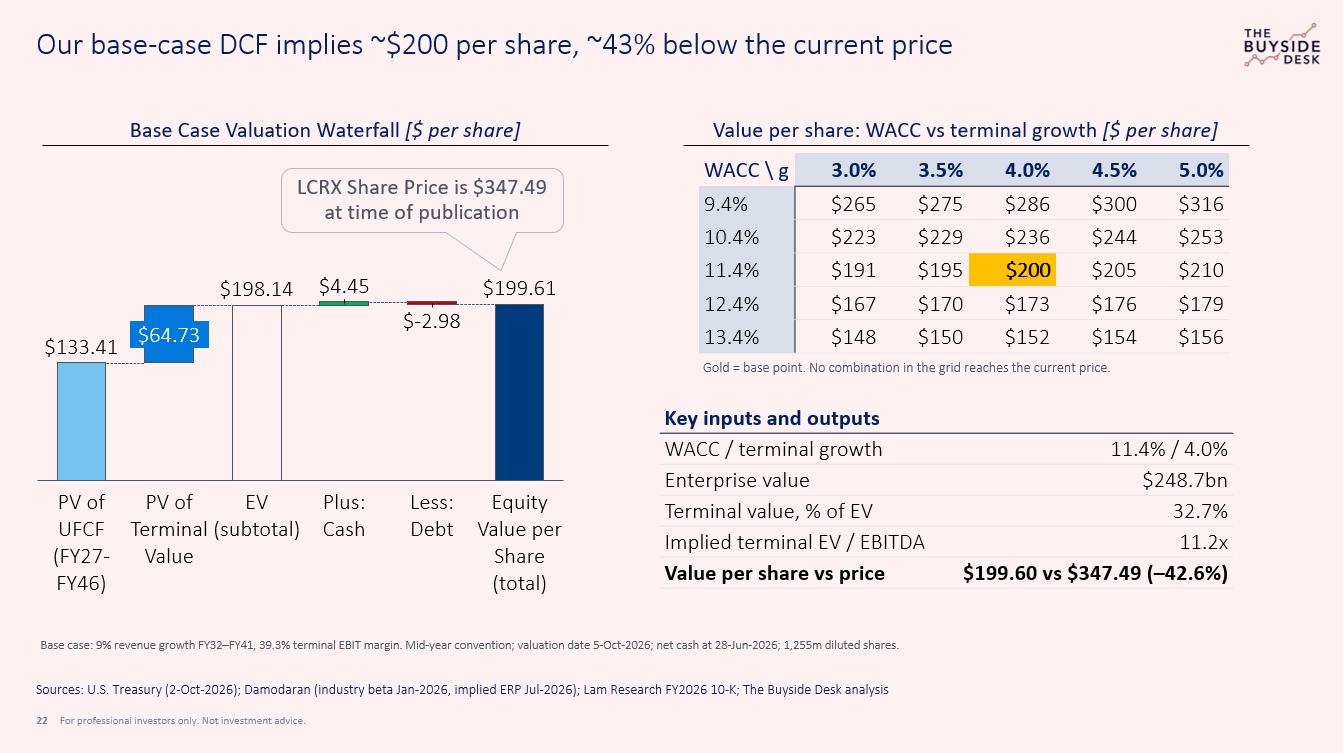
All three scenarios use the same 11.4% discount rate (WACC). It rests on today’s 5.28% 10-year Treasury yield, a semiconductor-equipment industry beta of 1.40 from Damodaran, and an implied equity risk premium of 4.42%. We use the industry beta rather than Lam’s own, more volatile, 1.86.
The base case repeats Lam’s history: 9% growth through FY41 and a 39% terminal EBIT margin, already well above the 29% ten-year average. It values Lam at about $200 per share, 43% below the current price. Even with a discount rate as low as 9.4%, the base case does not reach today’s price.
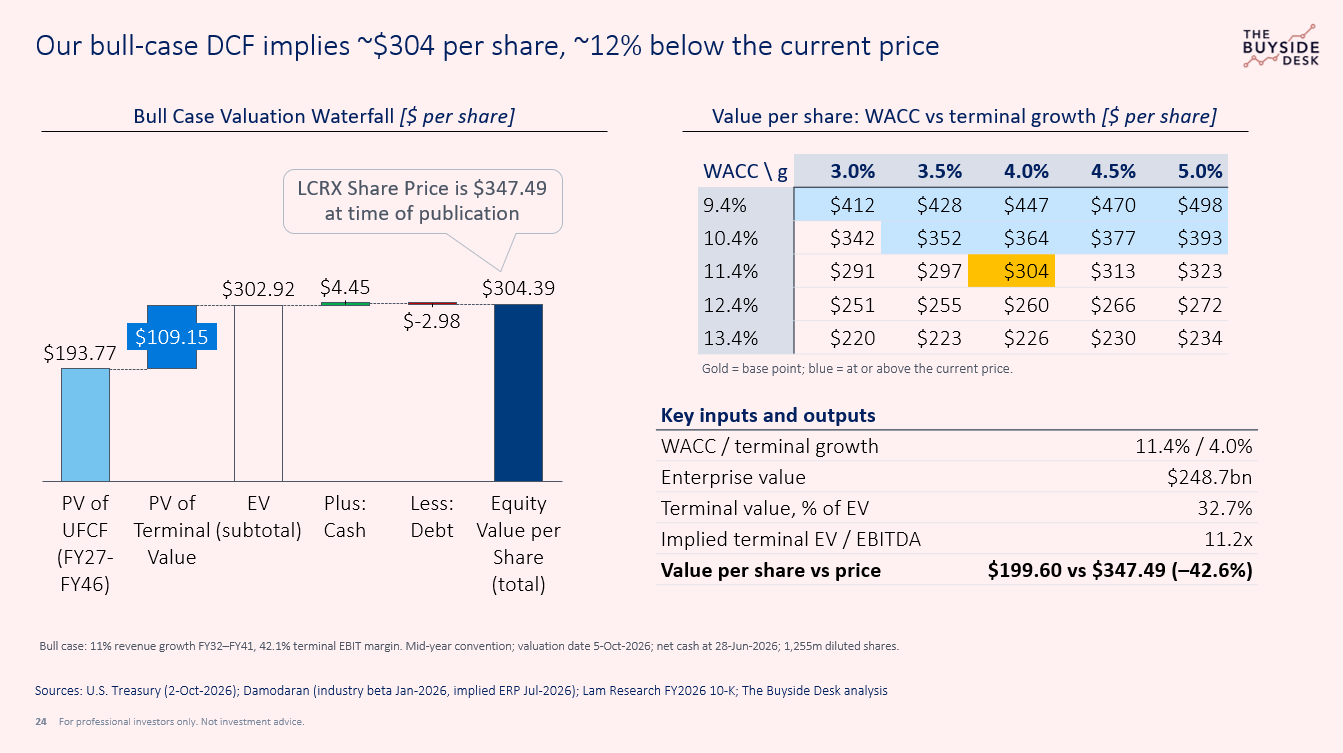
The bull case assumes consensus-level results through FY31, then 11% growth through FY41 and a 42% terminal margin, near management’s “mid-40s” long-term framework. That takes revenue to $232bn by FY46, roughly ten times today. It is worth $304 per share, still 12% below the price.
The bear case assumes a sharper cycle and 6% long-run growth, and is worth about $102. We don’t think it is the most likely outcome, but it shows how wide the range is.
What you have to believe at today’s price of $347 per share
If the bull case is worth $304, how does the stock trade at $347? The answer is interest rates. The 10-year Treasury yield is 5.28%, its highest level in about two decades. If it fell back to 4.5%, the discount rate would drop to about 10.6%. On those terms the bull case is worth $349, almost exactly today’s price. The base case would rise only to $227.
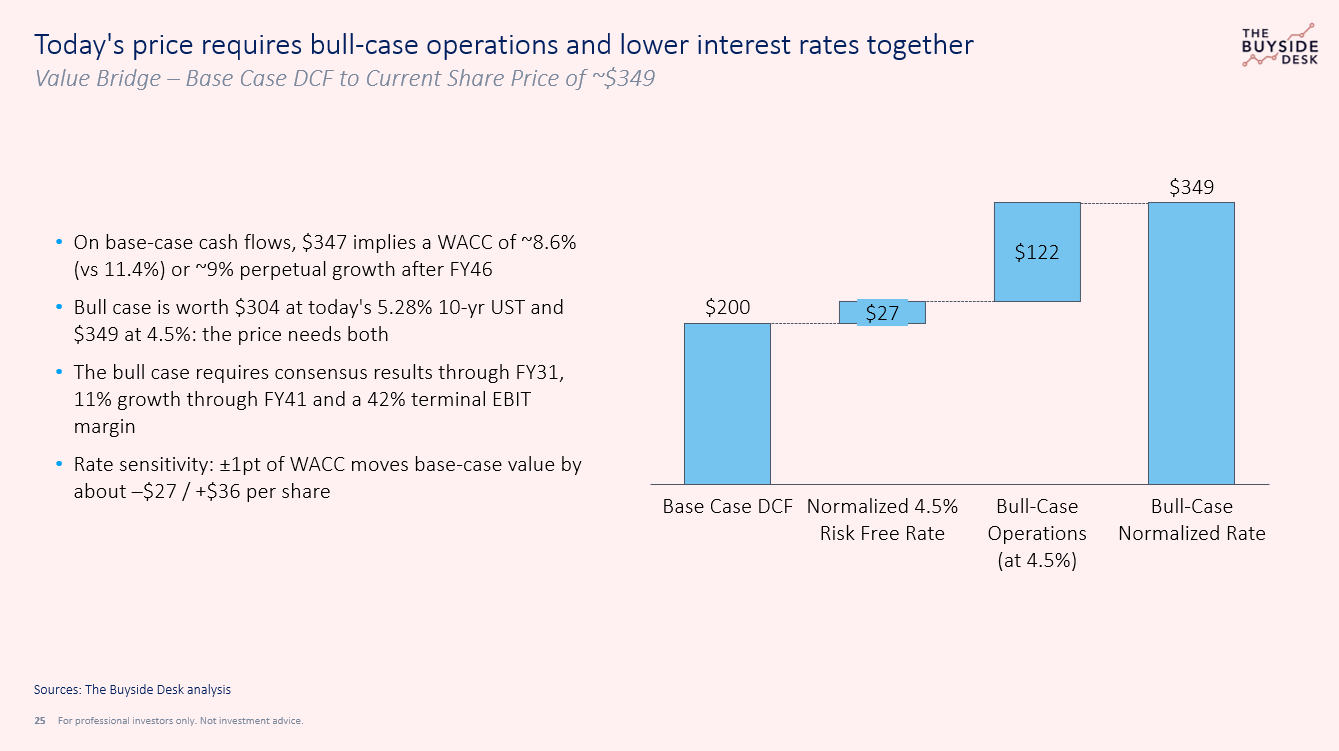
Put another way, the market price needs two things at once: growth well above Lam’s history for about fifteen years, and lower interest rates. Holding our base-case cash flows, the price implies a discount rate of about 8.6%, against our 11.4%.
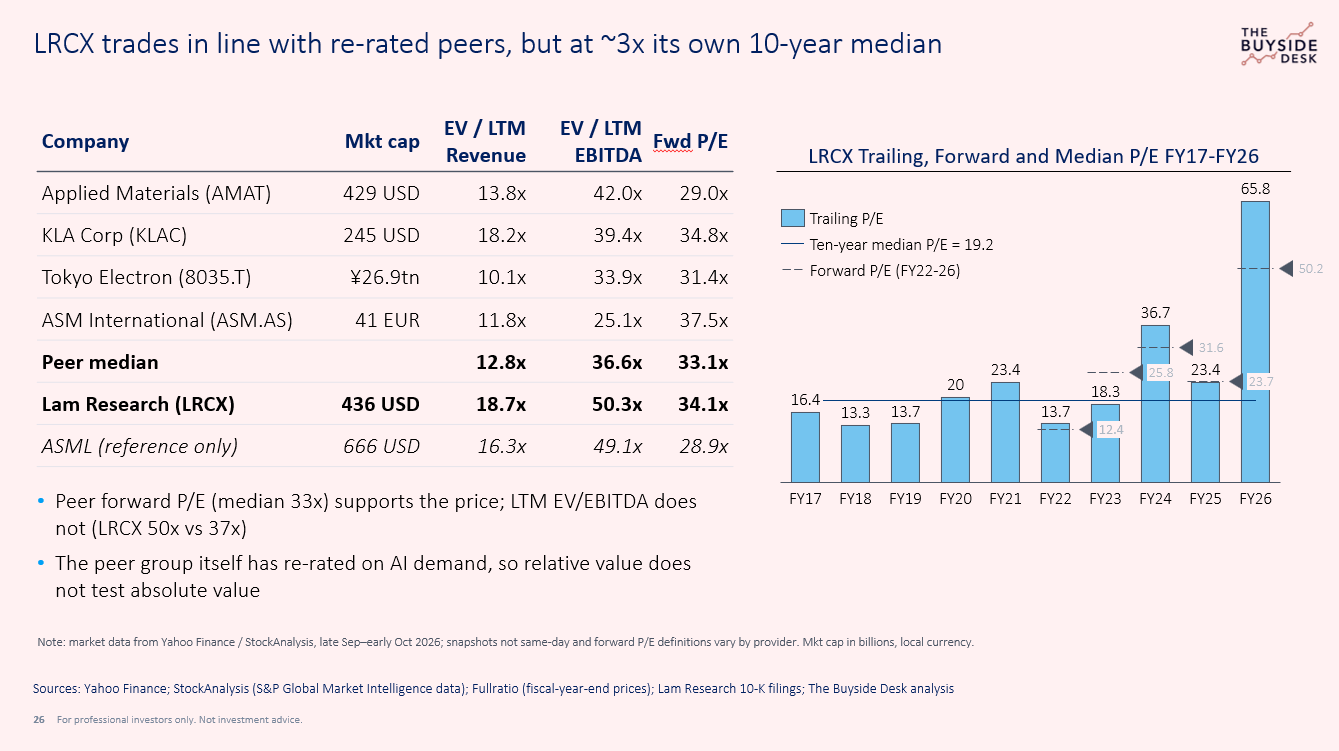
Multiples tell a similar story from a different angle. Against peers, Lam looks fairly priced. Its 34x forward P/E sits in line with the peer median of 33x across Applied Materials, KLA, Tokyo Electron and ASM International. Against its own history, it looks expensive. Lam’s ten-year median trailing P/E is 19x; today it is around 60x on trailing earnings, roughly three times that median. The whole peer group has re-rated on AI, so comparing Lam to peers tells you it is not out of line with the sector. It does not tell you the sector is cheap.
Pulling every method together, only two support the current price: the bull-case DCF and peer forward P/E. Everything else sits below it.
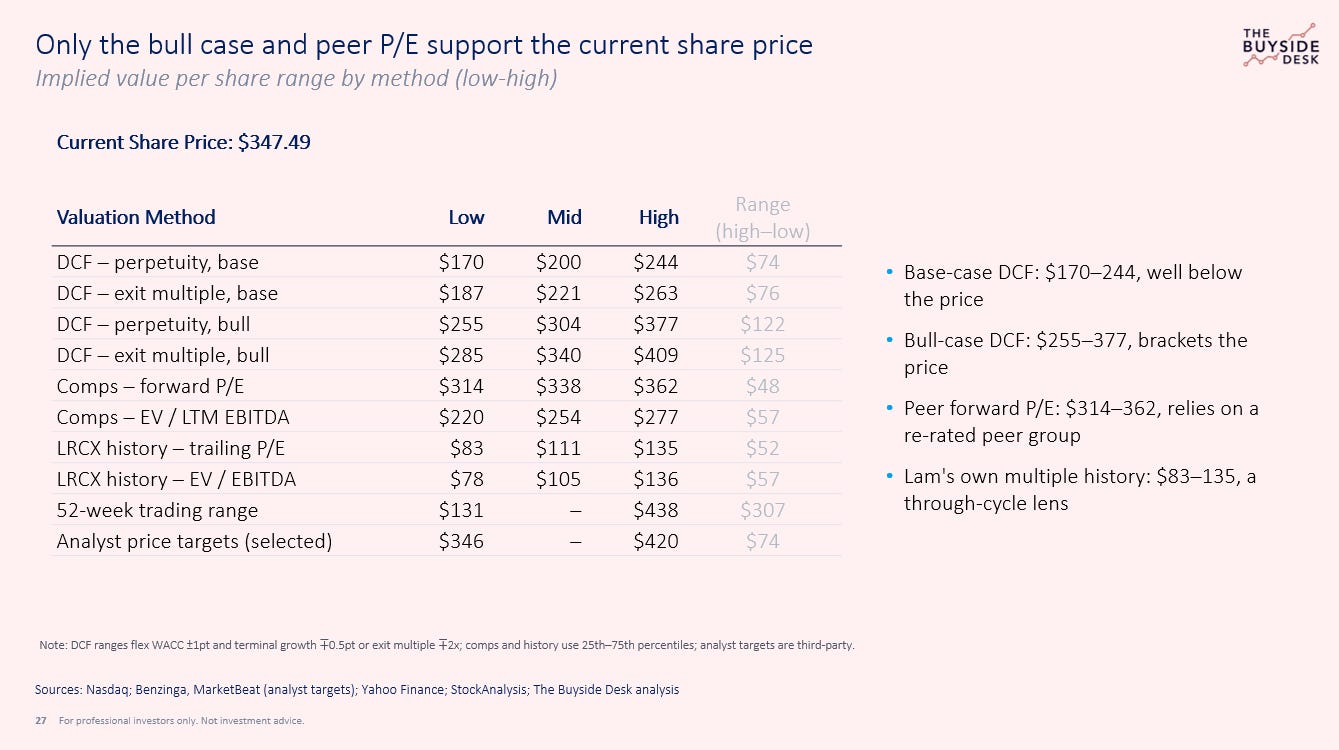
If you believe in historical patterns, today’s price implies 35-43% downside
The payoff is lopsided. If the bull case plays out, the stock is worth roughly what you pay for it today: –12% at current rates, about 0% if rates normalize. If Lam simply repeats its history, the base case implies 35–43% downside.
Key risks to our thesis:
China and export controls. China was 34% of FY26 revenue, and Lam’s 10-K warns those sales are likely to be materially affected by export licensing and regulatory change
Customer concentration. Four customers made up 55% of FY26 revenue, and five made up 72% of receivables
The cycle. Revenue fell 13–14% in each of the last two downturns, and memory is still 39% of systems revenue
Interest rates. Each one-point move in the discount rate shifts our base-case value by roughly $27–36 per share
Costs and supply. Tariffs on aluminum and steel weighed on FY26 margins; some parts are single-sourced.
The bottom line
Lam Research is one of the best businesses in semiconductors: a leader in the processes that 3D chips depend on, with expanding margins, sticky customer positions and disciplined capital returns. The share price already knows this. At $347, investors are not buying reasonable growth at a fair price. They are paying full value for an above-history outcome: roughly 11% growth for the next fifteen years, margins near management’s long-term ambition, and lower interest rates. That outcome is achievable. AI is a real and durable driver, and the industry may well grow faster than it has in the past. But the price leaves little margin of safety if any one of those assumptions slips.
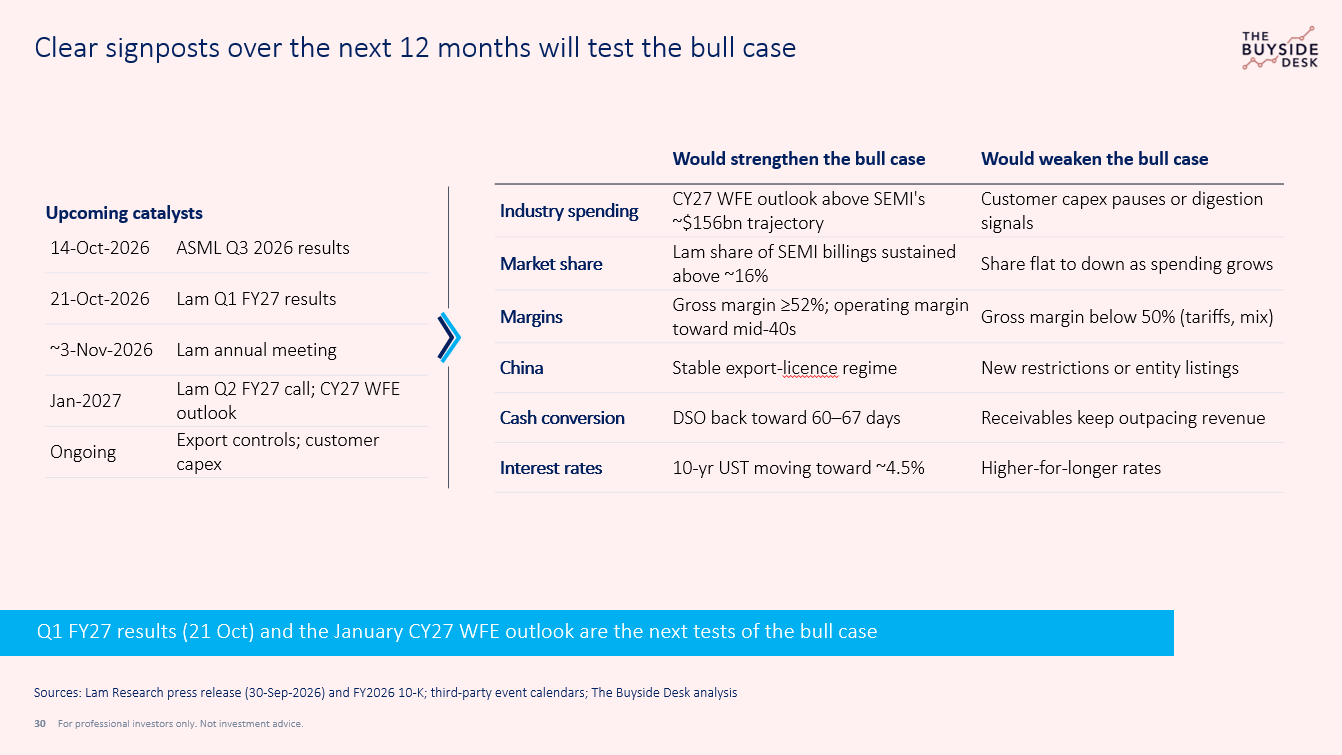
Our view: Lam Research stock is fully valued. We would become more constructive if Lam shows growth holding above its history beyond FY28, evidence of genuine market-share gains, or a lower interest-rate backdrop. A pullback that brings the price closer to our base case would change the arithmetic too.